Month: May 2021

Randomness decreases correlation – does it?

Intuition may tell us that increasing the randomness in the system (e.g., by increasing the variance of some random variables relative to their mean) will decrease the correlation between some random quantities of interest. A prominent example is the interference or SIR in a wireless network measured at two locations or in two time slots.

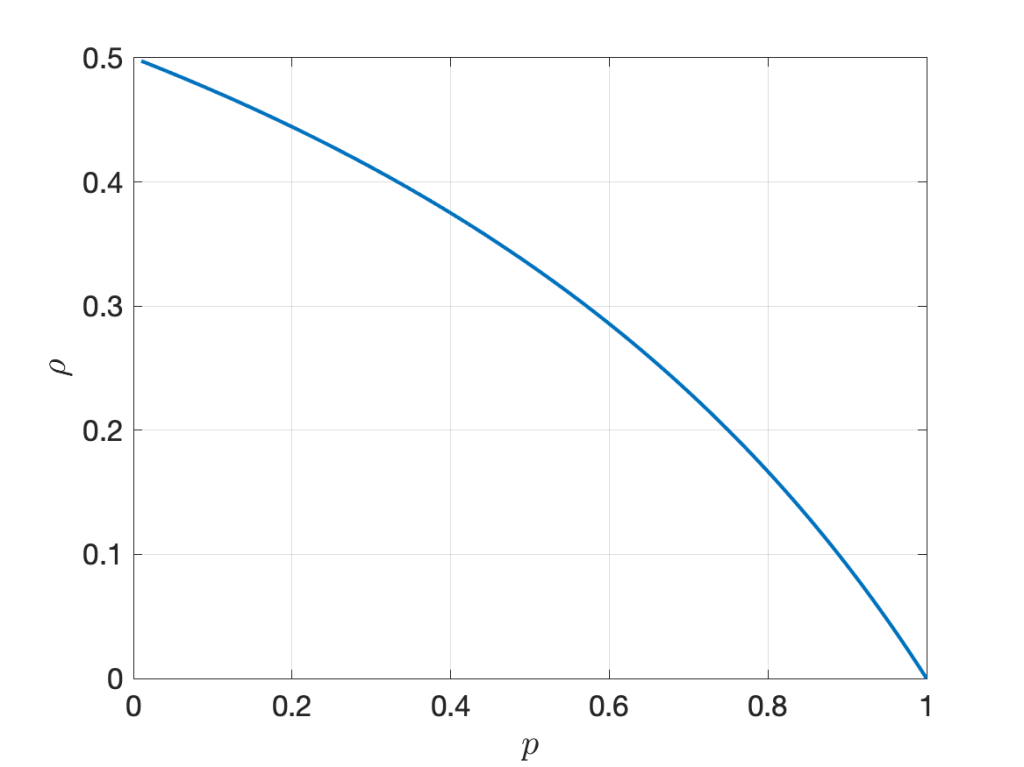
Let us consider a simple example to explore whether this intuition is correct. We consider the two random variables XY1 and XY2, where Y1 and Y2 are iid exponential with mean 1 and X is Bernoulli with mean p, independent of the Yk. In this case, Pearson’s correlation coefficient is

\displaystyle \rho(p)=\frac{p-p^2}{2p-p^2}.

It is illustrated in Figure 1 below. The randomness in X, measured by the ratio of variance to mean, is 1-p . However, increasing the randomness monotonically increases the correlation. As p approaches 0, the correlation tends to its maximum of 1/2.

Figure 1: Correlation coefficient of XY1 and XY2 where X is Bernoulli(p) and Yk are iid exponential(1).

Next, let Y1 and Y2 be independent and Bernoulli with mean p and X gamma distributed with parameters m and 1/m, such that the mean of X is 1 and the variance 1/m. Again we focus on the correlation of the two products XY1 and XY2. In this case, the correlation coefficient is

\displaystyle \rho(p,m)=\frac{p^2}{p(1+m)-m p^2},

shown in Figure 2 below for different values of m. Again, we observe that increasing the randomness in X (decreasing m) increases the correlation for all p <1. For p =1, the correlation is 1 since both random variables equal X.

Figure 2: Correlation coefficient of XY1 and XY2 where X is gamma(m,1/m) and Yk are iid Bernoulli(p).

So is the relationship between randomness and correlation completely counter-intuitive? Not quite, but our intuition is probably skewed towards the case of independent randomness, as opposed to common randomness. In the second example, the randomness in Y1 and Y2 decreases with p, and the correlation coefficient increases with p, as expected. Here Y1 and Y2 are independent. In contrast, X is the common randomness. If its variance increases, the opposite happens – the randomness decreases.

In the wireless setting, the common randomness is often the point process of transceiver locations, while the independent randomness usually comprises the fading coefficients and the channel access indicators. One of the earliest results on correlations in wireless networks is the following: For transmitters forming a PPP, with each one being active independently with probability p in each time slot (slotted ALOHA) and independent Nakagami-m fading, the correlation coefficient of the interference measured at the same location in two different time slots is (see Cor. 2 in this paper)

\displaystyle \qquad\qquad\qquad\qquad\qquad\rho(p,m)=\frac{pm}{m+1}.\qquad\qquad (*)

Here the fading coefficients have the same gamma distribution as in the second example above. As expected, increasing the randomness in the channel access (decreasing p) and in the fading (decreasing m) both reduce the correlation. Conversely, setting p =1 and letting m → ∞, the correlation coefficient is 1. However, the correlation is induced by the PPP as the common randomness – if the node placement was deterministic, the correlation would be 0. In other words, the interference in different times slots is conditionally independent given the PPP. This conditional independence is exploited in the analysis of important metrics such as the local delay and the SIR meta distribution.

One last remark. The expression (*) shows that the correlation coefficient is simply the product of the transmit probability p and the Nakagami fading parameter m mapped to the (0,1) interval using the Möbius homeomorphic transform described here, which is m /(m+1). This shows a nice symmetry in the impact of channel access and fading.

Rayleigh fading and the PPP – part 2

The previous blog highlighted that the Rayleigh fading channel model and the Poisson deployment model are very similar in terms of their tractability and in how realistic they are. It turns out that Rayleigh fading and the PPP are the neutral cases of channel fading and node deployment, respectively, in the following sense:

  • For Rayleigh fading, the power fading coefficients are exponential random variables with mean 1, which implies that the ratio of mean and variance is 1. If the ratio is smaller (bigger variance), the fading is stronger. If the variance goes to 0, there is less and less fading.
  • For the PPP, the ratio of the mean number of points in a finite region to its variance is 1. If the ratio is larger than 1, the point process is sub-Poissonian, and if the ratio is less than 1, it is super-Poissonian.

Prominent examples of super-Poissonian point processes are clustered processes, where clusters of points are placed at the points of a stationary parent process, and Cox processes, which are PPPs with random intensity measures. Sub-Poissonian processes include hard-core processes (e.g., lattices or Matérn hard-core processes) and soft-core processes (e.g., the Ginibre point process or other determinantal point processes, or hard-core processes with perturbations).

There is no convenient family of point process where the entire range from lattice to extreme clustering can be covered by tuning a single parameter. In contrast, for fading, Nakagami-m fading represents such a family of models. The power fading coefficients are gamma distributed with parameters m and 1/m, i.e., the probability density function is

\displaystyle f(x)=\frac{m^m}{\Gamma(m)}x^{m-1}e^{-mx}

with variance is 1/m. The case m =1 is the neutral case (Rayleigh fading), while 0<m <1 is strong (super-Rayleigh) fading, and m >1 is weak (sub-Rayleigh) fading. The following table summarizes the different classes of fading and point process models. NND stands for the nearest-neighbor distance of the typical point.

fadingpoint process
rigidno fading (m → ∞)lattice (deterministic NND)
weakly randomm >1 (sub-Rayleigh)repulsive (sub-Poissonian)
neutralm =1 (Rayleigh)PPP
strongly randomm <1 (super-Rayleigh)clustered (super-Poissonian)
extremely randomm → 0clustered with mean NND → 0
(while maintaining density)

It is apparent that the Rayleigh-PPP model offers a good balance in the amount of randomness – not too weak and not too strong. Without specific knowledge on how large the variances in the channel coefficients and in the number of points in a region are, it is the natural default assumption. The other key reason why the combination of exponential (power) fading and the PPP is so symbiotic and popular is its tractability. It is enabled by two properties:

  • with Rayleigh fading in the desired link, the SIR distribution is given by the Laplace transform of the interference;
  • the Laplace transform, written as an expected product over the points process, has the form of a probability generating functional, which has a closed-form expression for the PPP.

The fading in the interfering channels can be arbitrary; what is essential for tractability is only the fading in the desired link.

Rayleigh fading and the PPP

When stochastic geometry applications in wireless networking were still in their infancy or youth, I was frequently asked “Do you believe in the PPP model?”. I usually answered with a counter-question:“Do you believe in the Rayleigh fading model?”. This “answer” was motivated by the high likelihood that the person asking
was

  • familiar with the idea of modeling the effects of multi-path propagation using Rayleigh fading;
  • found it not only acceptable but quite natural to use a model with obvious shortcomings and limitations, for the sake of analytical tractability and design insight.

It usually turned out that the person quickly realized that the apparent shortcomings of the PPP model are quite comparable to those of the Rayleigh fading model, and that, conversely, they both share a high level of tractability.

Surely if one can accept that wireless signals propagate along infinitely many paths of comparable propagation loss with independent phases, resulting in a random received power with infinite support, one can accept a point process model with infinitely many points that are, loosely speaking, independently placed. If one can accept that at 0 dBm transmit power, there is a positive probability that the power received over a 1 km distance exceeds 90 dBm (1 MW), then surely one can accept that there is a positive probability that two points are separated by only 1 cm.

So why is it that Rayleigh fading was (and perhaps still is) more acceptable than the PPP? Is it just that Rayleigh fading has been used for wireless channel modeling for much longer than the PPP? Perhaps. But maybe part of the answer lies in what prompts us to use stochastic models in the first place.

Fundamentally there is no randomness in wireless propagation. If we know the characteristics of the antennas and the locations and properties of all objects, we can calculate the channel parameters exactly (say by raytracing) – and if there is no mobility, the channel stays fixed forever. So why introduce randomness where there is none? There are two reasons:

  • Raytracing is computationally expensive
  • The results obtained only apply to one very specific scenario. If a piece of furniture is moved a bit, we need to start from scratch.

Often the goal is to design a communication architecture, but such design cannot be based on the layout of a specific room. So we need a model that captures the characteristics of the channels in many rooms in many buildings, but obtaining such a large data set would be very expensive, and it would be hard to derive any useful insight from it. In contrast, a random model offers simplicity and superior tractability.

Similarly, in a network of transceivers, we could in principle assume that all their locations (and mobility vectors) are known, plus their transmit powers. Then, together with the (deterministic) channels, the interference power would be a deterministic quantity. This is very impractical and, as above, we do not want to decide on the standards for 7G cellular networks based on a given set of base station and user (and pet and vacuum robot and toaster and cactus) locations. Instead we aim for the robust design that a random spatial model (i.e., a point process) offers.

Another aspect here is that the channel fading process is often perceived (and modeled) as a random process in time. Although any temporal change in the channel is but a consequence of a spatial change, it is convenient to disregard the purely spatial nature of fading and assume it to be temporal. Then we can apply the standard machinery for temporal random processes in the performance analysis of a link. This includes, in particular, ergodicity, which conveniently allows us to argue that over some time period the performance will be close to that predicted by the ensemble average. The temporal form of ergodicity appears to be much more ingrained in our thinking than its spatial counterpart, which is at least as powerful: in an ergodic point process, the average performance of all links in each realization corresponds to that of the typical link (in the sense of the ensemble average). In the earlier days of stochastic geometry applications to wireless networks this key equivalence was not well understood – in particular by reviewers. Frequently they pointed out that the PPP model (or any point process model for that matter) is only relevant for networks with very high mobility, believing that only high mobility would justifiy the ensemble averaging. Luckily this is much less of an issue nowadays.

So far we have discussed Rayleigh fading and the PPP separately. The true strength of these simple models becomes apparent when they are combined into a wireless network model. In fact, most of the elegant closed-form stochastic geometry results for wireless networks are based on (or restricted to) this combination. There are several reason for this symbiotic relationship between the two models, which we will explore in a later post.