Simulations can be quite time-consuming. Are there any techniques that can help make them more efficient and/or accurate? Let us focus on a concrete problem. Say we would like to plot the SIR distribution in a Poisson bipolar network for different path loss exponents α, including some values close to 2. Since we would like to compare the result with the exact one, we focus on the Rayleigh fading case where the analytical expression is known and simple. The goal is to get accurate curves for α=3, 2.5, 2.25, and 2.1, and we would like to wait no longer than 1 s for the results on a standard desktop or laptop computer.
Let us first discuss why this is a non-trivial problem. It involves averaging w.r.t. the fading and the point process, and we need to make sure that the number of interferers is large enough for good accuracy. But what is “large enough”? A quick calculation using Campbell’s theorem (for sums) reveals that if we want to capture 99% of the mean interference power (outside radius 1 to avoid complications due to a potential singularity in the path loss law), we find that for α=3, the simulation region needs to be 100 times larger than for α=4. This seems manageable, but for α=2.5, 2.25, 2.1, it is 106, 1014, 1038 times larger, respectively!
Clearly the straightforward approach of producing many realizations of the PPP in a large region does not work in the regime of small α. So how can we achieve our goal above – high accuracy and high efficiency?
The solution is to use an analysis-enhanced simulation technique, which I call simalysis. While we often tend to think as analysis vs. simulation as a dichotomy, in this approach they are used symbiotically. The idea is to exploit analytical results whenever possible to make simulations faster and more accurate. Let me illustrate how simalysis works when applied to the problem above.
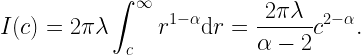
For small α, it is impossible to “capture” most of the interference solely by simulation. In fact, most of it stems from the infinitely many distance nodes, each one contributing little, with independent fading. We can thus assume that the variance of the interference of the nodes further than a certain distance (relatively large compared with the mean nearest-neighbor distance) is relatively small. Accordingly, replacing it by its mean is a sensible simplification. Here is where the analysis comes in. For any stationary point process of density λ, the mean interference from the nodes outside distance c is
This interference term can then be added to the simulated interference, which stems from points within distance c. Simulating as few as 50 points is enough for very high accuracy. The result is shown in the figure below, using the MH scale so that the entire distribution is revealed (see this post for details on the MH scale). For α near 2, the curves are indistinguishable!
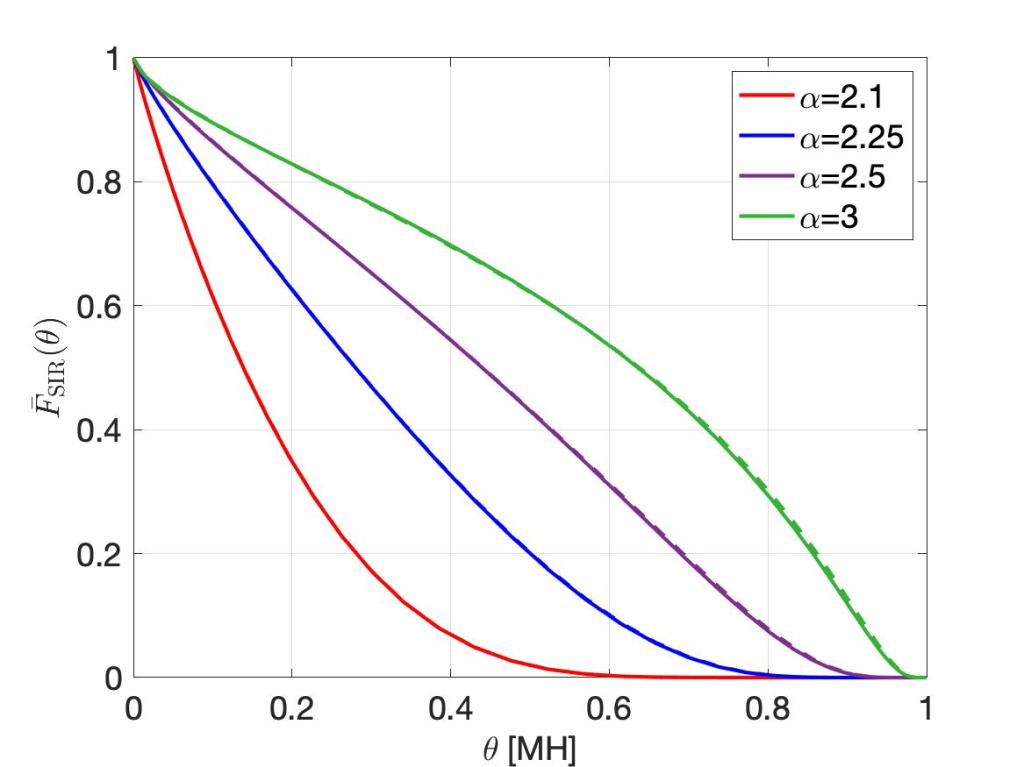
The solid lines are obtained by simalysis, the dashed lines show the exact analytical results.
This simulation averages over 500 realizations of the PPP and runs in less than 1 s on a laptop. The Matlab code is available here. It uses a second simalytic technique, namely the analytical averaging over the fading. Irrespective of the type of point process we want to simulate, as long as the fading is Rayleigh, we can perform the averaging over the fading analytically.
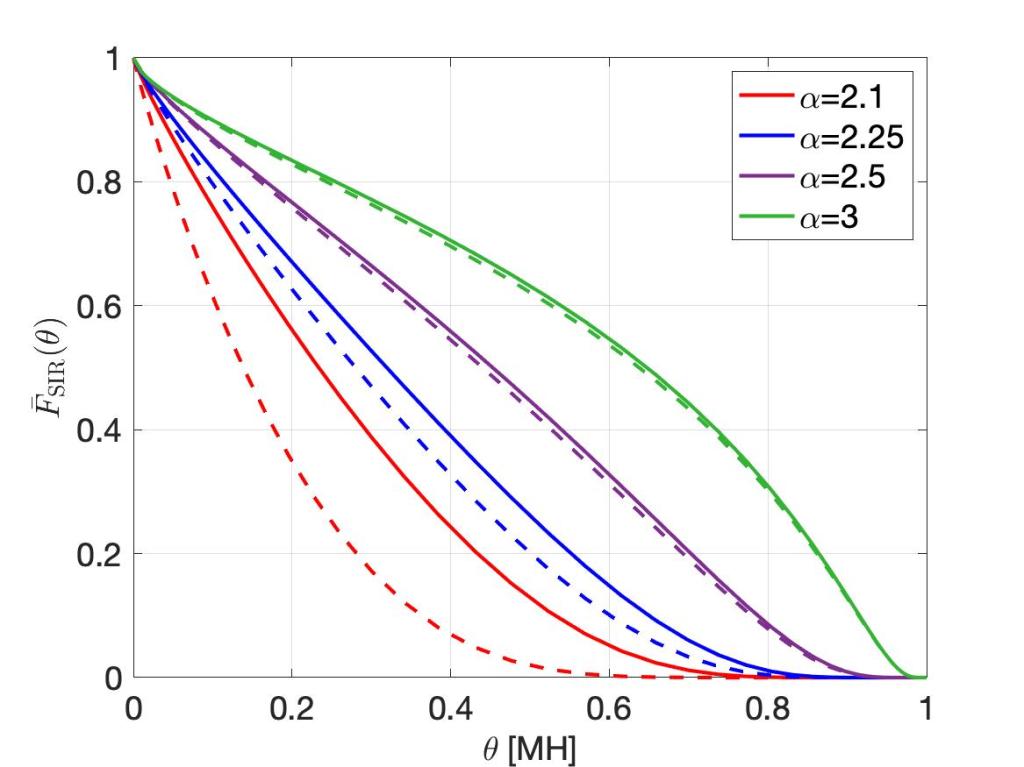
For comparison, the figure below shows the simulation results if 500,000 points (interferers) are simulated, without adding the analytical mean interference term, i.e., using classical simulation. Despite taking 600 times longer, the distributions for α<2.5 are not acceptable.

Interesting insights, semi-analytical simulation methods for communication systems can provide a significant boost for validating results. However, these approaches are not discussed in the context of stochastic geometry frequently, so very interesting post.
LikeLike
Thanks for the comment. Indeed, it will be interesting to see what can be learnt from similar ideas that are used elsewhere.
LikeLiked by 1 person